Original Link: https://www.anandtech.com/show/6153/plextor-m5-pro-256gb-review
Plextor M5 Pro (256GB) Review
by Kristian Vättö on August 31, 2012 11:32 AM ESTIntroduction
Plextor's strength lies in performance and quality. As we saw with the M3 Pro, they have a firmware team capable of delivering top-of-the-class performance: The M3 Pro was easily the fastest Marvell 88SS9174 based SSD and overall it was one of the fastest SATA 6Gbps SSDs we have ever tested. When looking at NewEgg reviews, Plextor's SSDs have only few one or two-egg reviews, which speaks for many satisfied customers. With the performance and quality combo, Plextor's SSDs are not as price competitive as some other SSDs are, although Plextor is aiming for wider audience with the M5S.
Due to our positive experience with Plextor's SSDs, I've been super excited about the M3 Pro's successor: the M5 Pro. Plextor is the first SSD manufacturer to use Marvell's new 88SS9187 controller, which is paired with Toshiba's brand new 19nm Toggle-Mode MLC NAND. I can't lie, I've been looking forward to reviewing the M5 Pro for quite a while. Ever since the M3 Pro review, I've been waiting for something faster. The M5S was merely an incremental update with different NAND and new firmware; it didn't bring any major performance improvements. The M5 Pro should eliminate the possible bottlenecks created by Marvell's 9174 but as there are currently no other Marvell 9187 based SSDs (OCZ Vertex 4 and Agility 4 may be, but there hasn't been any confirmation on the exact silicon), it's rather hard to know what to expect. Given the performance of the M3 Pro, the bar has been set high and if the M5 Pro is faster than M3 Pro, we may be looking at the fastest SATA 6Gbps SSD on the market. Lets start off with the specifications:
| Plextor M5 Pro Specifications | |||
| Model | PX-128M5P | PX-256M5P | PX-512M5P |
| Controller | Marvell 88SS9187 | ||
| NAND | Toshiba 19nm Toggle-Mode MLC NAND | ||
| Raw NAND Capacity | 128GiB | 256GiB | 512GiB |
| User Capacity | 119.2GiB | 238.5GiB | 476.9GiB |
| Number of NAND Packages | 8 | 8 | 8 |
| Number of Die per Package | 2 | 4 | 8 |
| Sequential Read | 540MB/s | 540MB/s | 540MB/s |
| Sequential Write | 340MB/s | 450MB/s | 450MB/s |
| 4K Random Read | 91K IOPS | 94K IOPS | 94K IOPS |
| 4K Random Write | 82K IOPS | 86K IOPS | 86K IOPS |
| Cache (DDR3) | 256MB | 512MB | 768MB |
| Warranty | 5 years | ||
Plextor doesn't offer a 64GB M5 Pro at all. There was no 64GB M3 Pro either, so this is hardly a surprise. 60/64GB SSDs are more about price because the limited NAND bandwidth is already a bottleneck and users buying such small SSDs are already making a compromise. With 128GB SSDs selling for less than $100, I see no point in buying a 60/64GB SSD anyway - you get twice the capacity and much better performance for only $10-$40 more. On the other hand, there is no 512GB SKU in the M5S lineup, so you need to jump for the M5 Pro if you need more than 256GB.
| NewEgg Price Comparison (8/31/2012) | ||||
| 64GB | 128GB | 256GB | 512GB | |
| Plextor M5 Pro | N/A | $190 (MSRP) | $320 (MSRP) | $650 (MSRP) |
| Plextor M5S | $70 | $85 | $200 | N/A |
| Plextor M3 Pro | N/A | $160 | $270 | $650 |
| Plextor M3 | N/A | $130 | $250 | $400 |
| Crucial m4 | $73 | $110 | $210 | $400 |
| Intel 520 Series | $100 | $132 | $230 | $500 |
| Samsung 830 Series | $85 | $119 | $230 | $570 |
| OCZ Vertex 3 | $70 | $85 | $180 | $500 |
| OCZ Vertex 4 | $65 | $110 | $190 | $530 |
US availability has been delayed until mid-September, so all we have for now are the manufacturer suggested retail prices (MSRPs). Usually MSRPs are noticeably higher than what street prices end up being but the M5 Pro is definitely not cheap. My guess is that the M5 Pro will take the price points of M3 Pro once it becomes available as that is what happened with the M5S and M3. However, the M3 Pro is not very affordable when compared to other SSDs, so you'll have to pay a premium if you want Plextor's Pro SSD.
Inside the M5 Pro
The external design is still the same as in the M3 Pro. Likewise, the M5 Pro measures in at 7mm height.
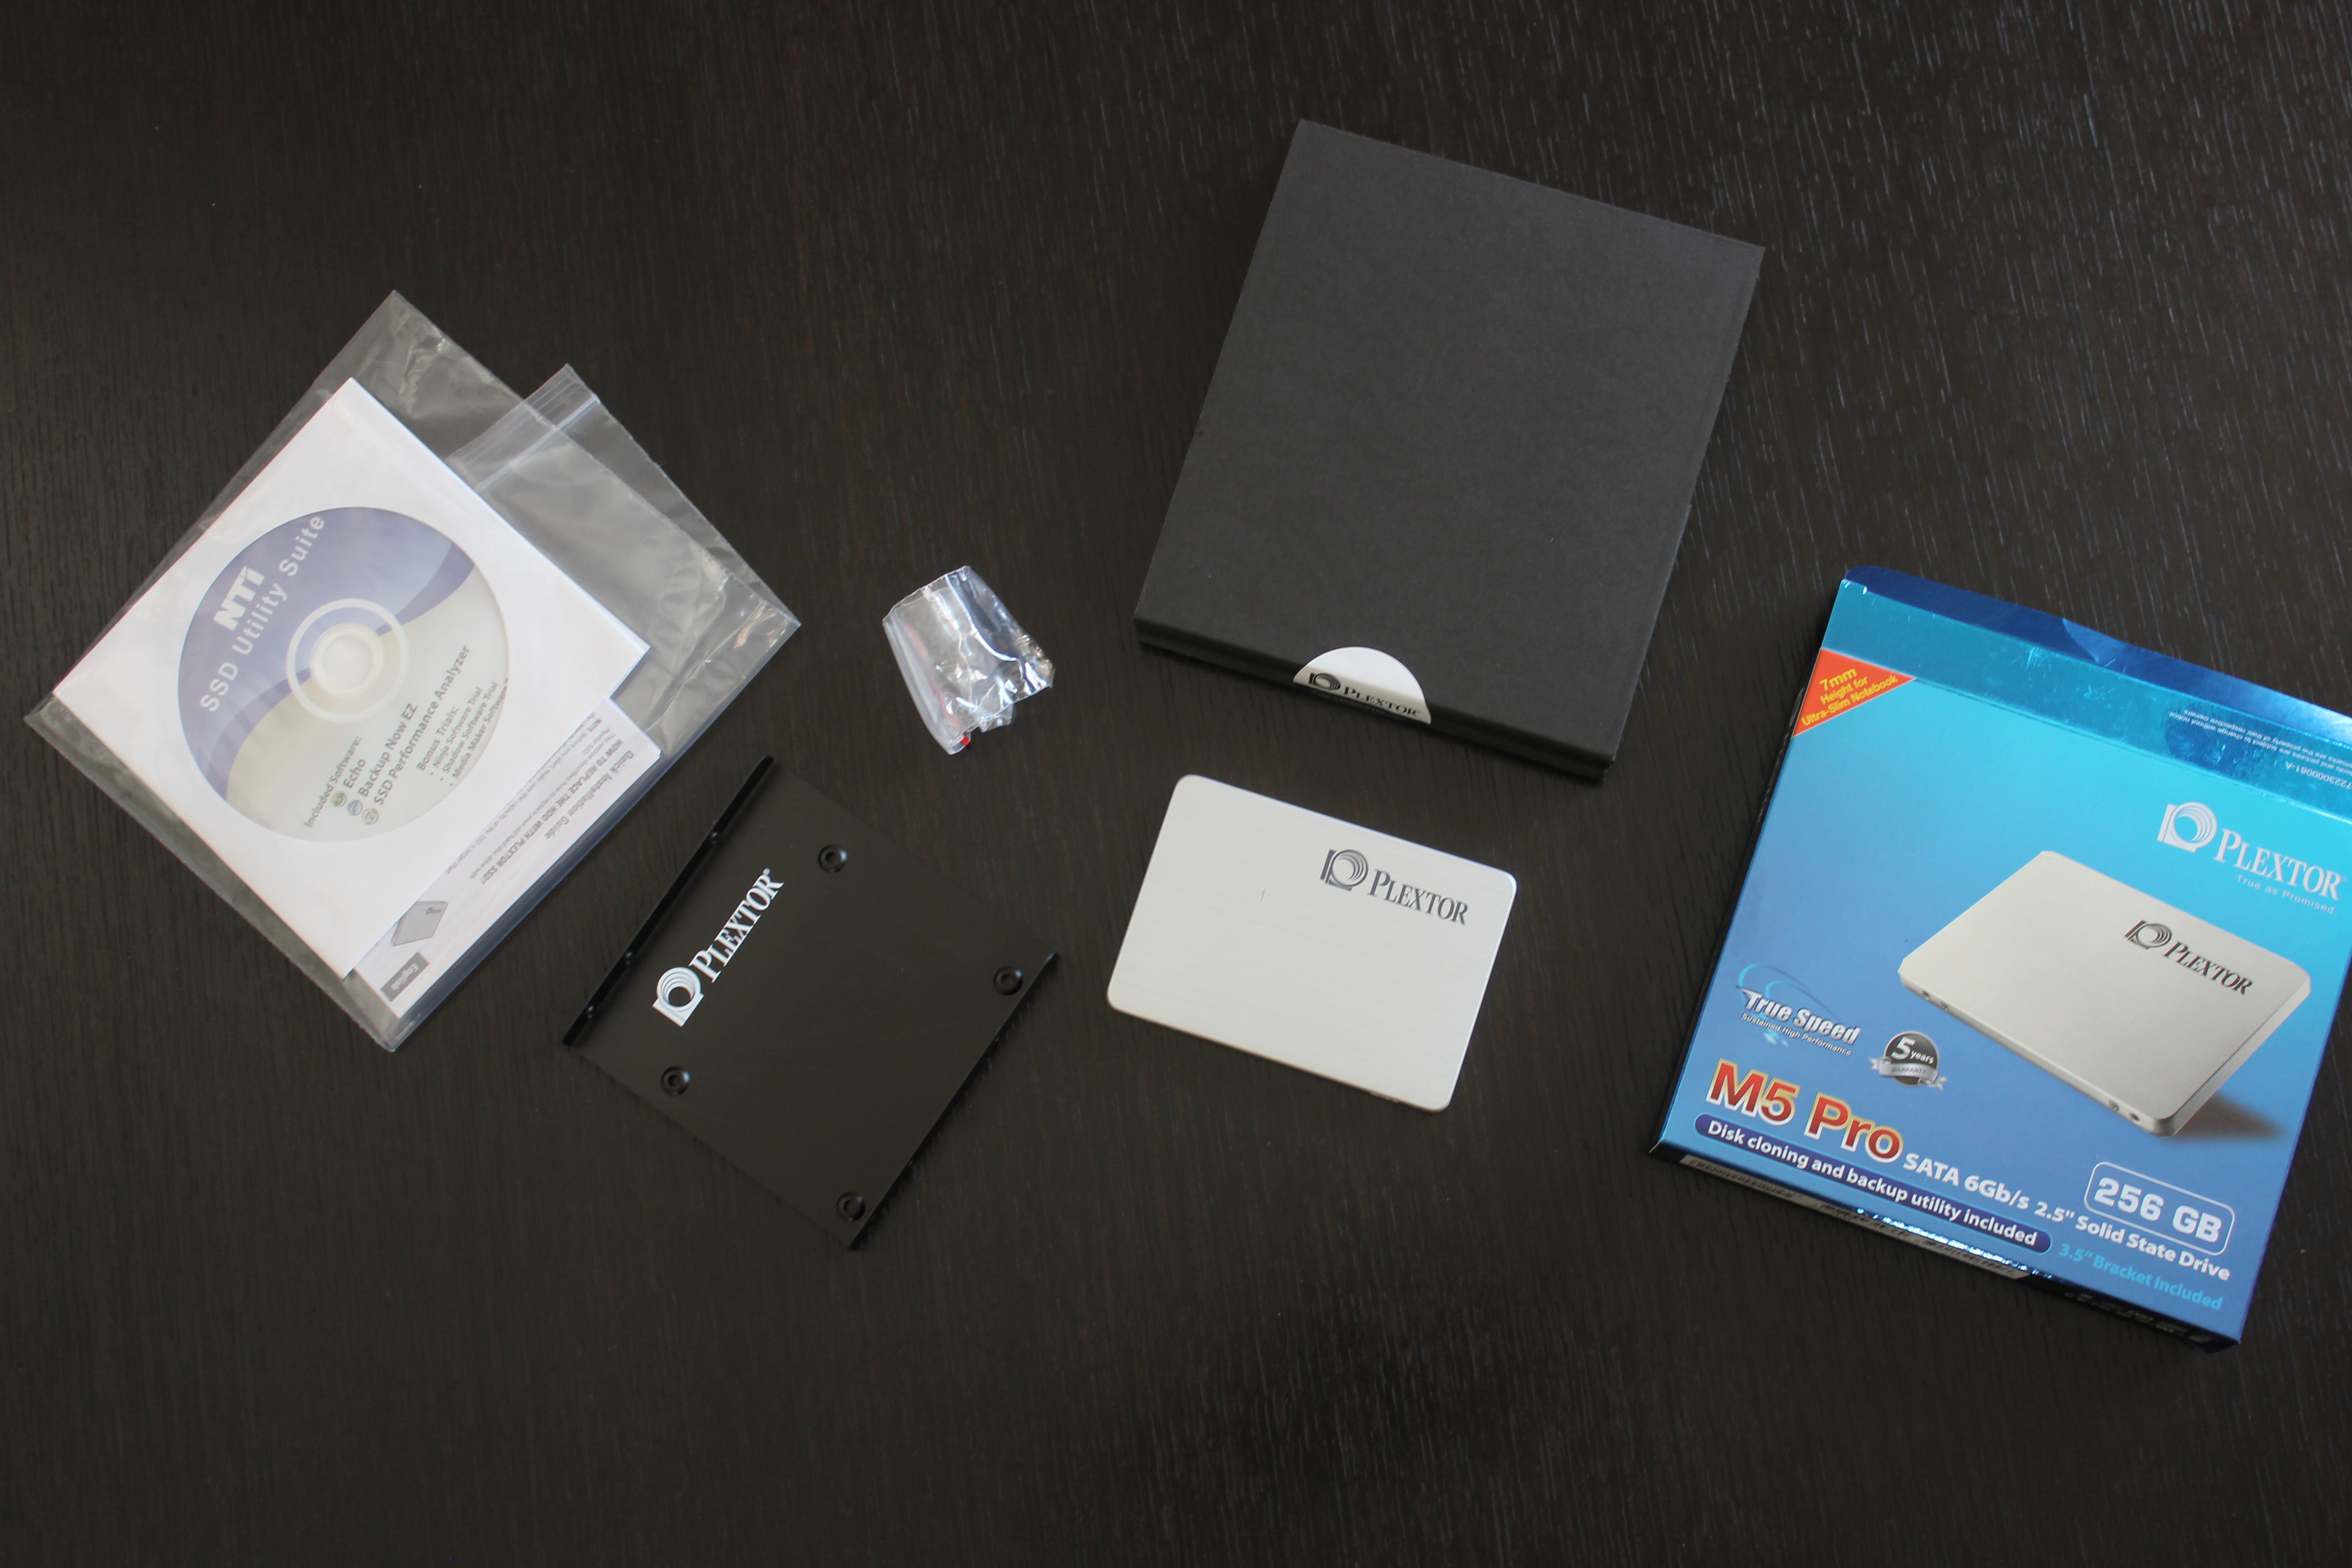
Plextor provides a variety of add-ons in the retail package. There is a 2.5" to 3.5" adapter, mounting screws and NTI's SSD utility suite including clone, backup and SSD performance tools (though I've heard the bundled software may be regional. Some European buyers of the M3/Pro have said that their SSD came with Acronis' SSD tools).
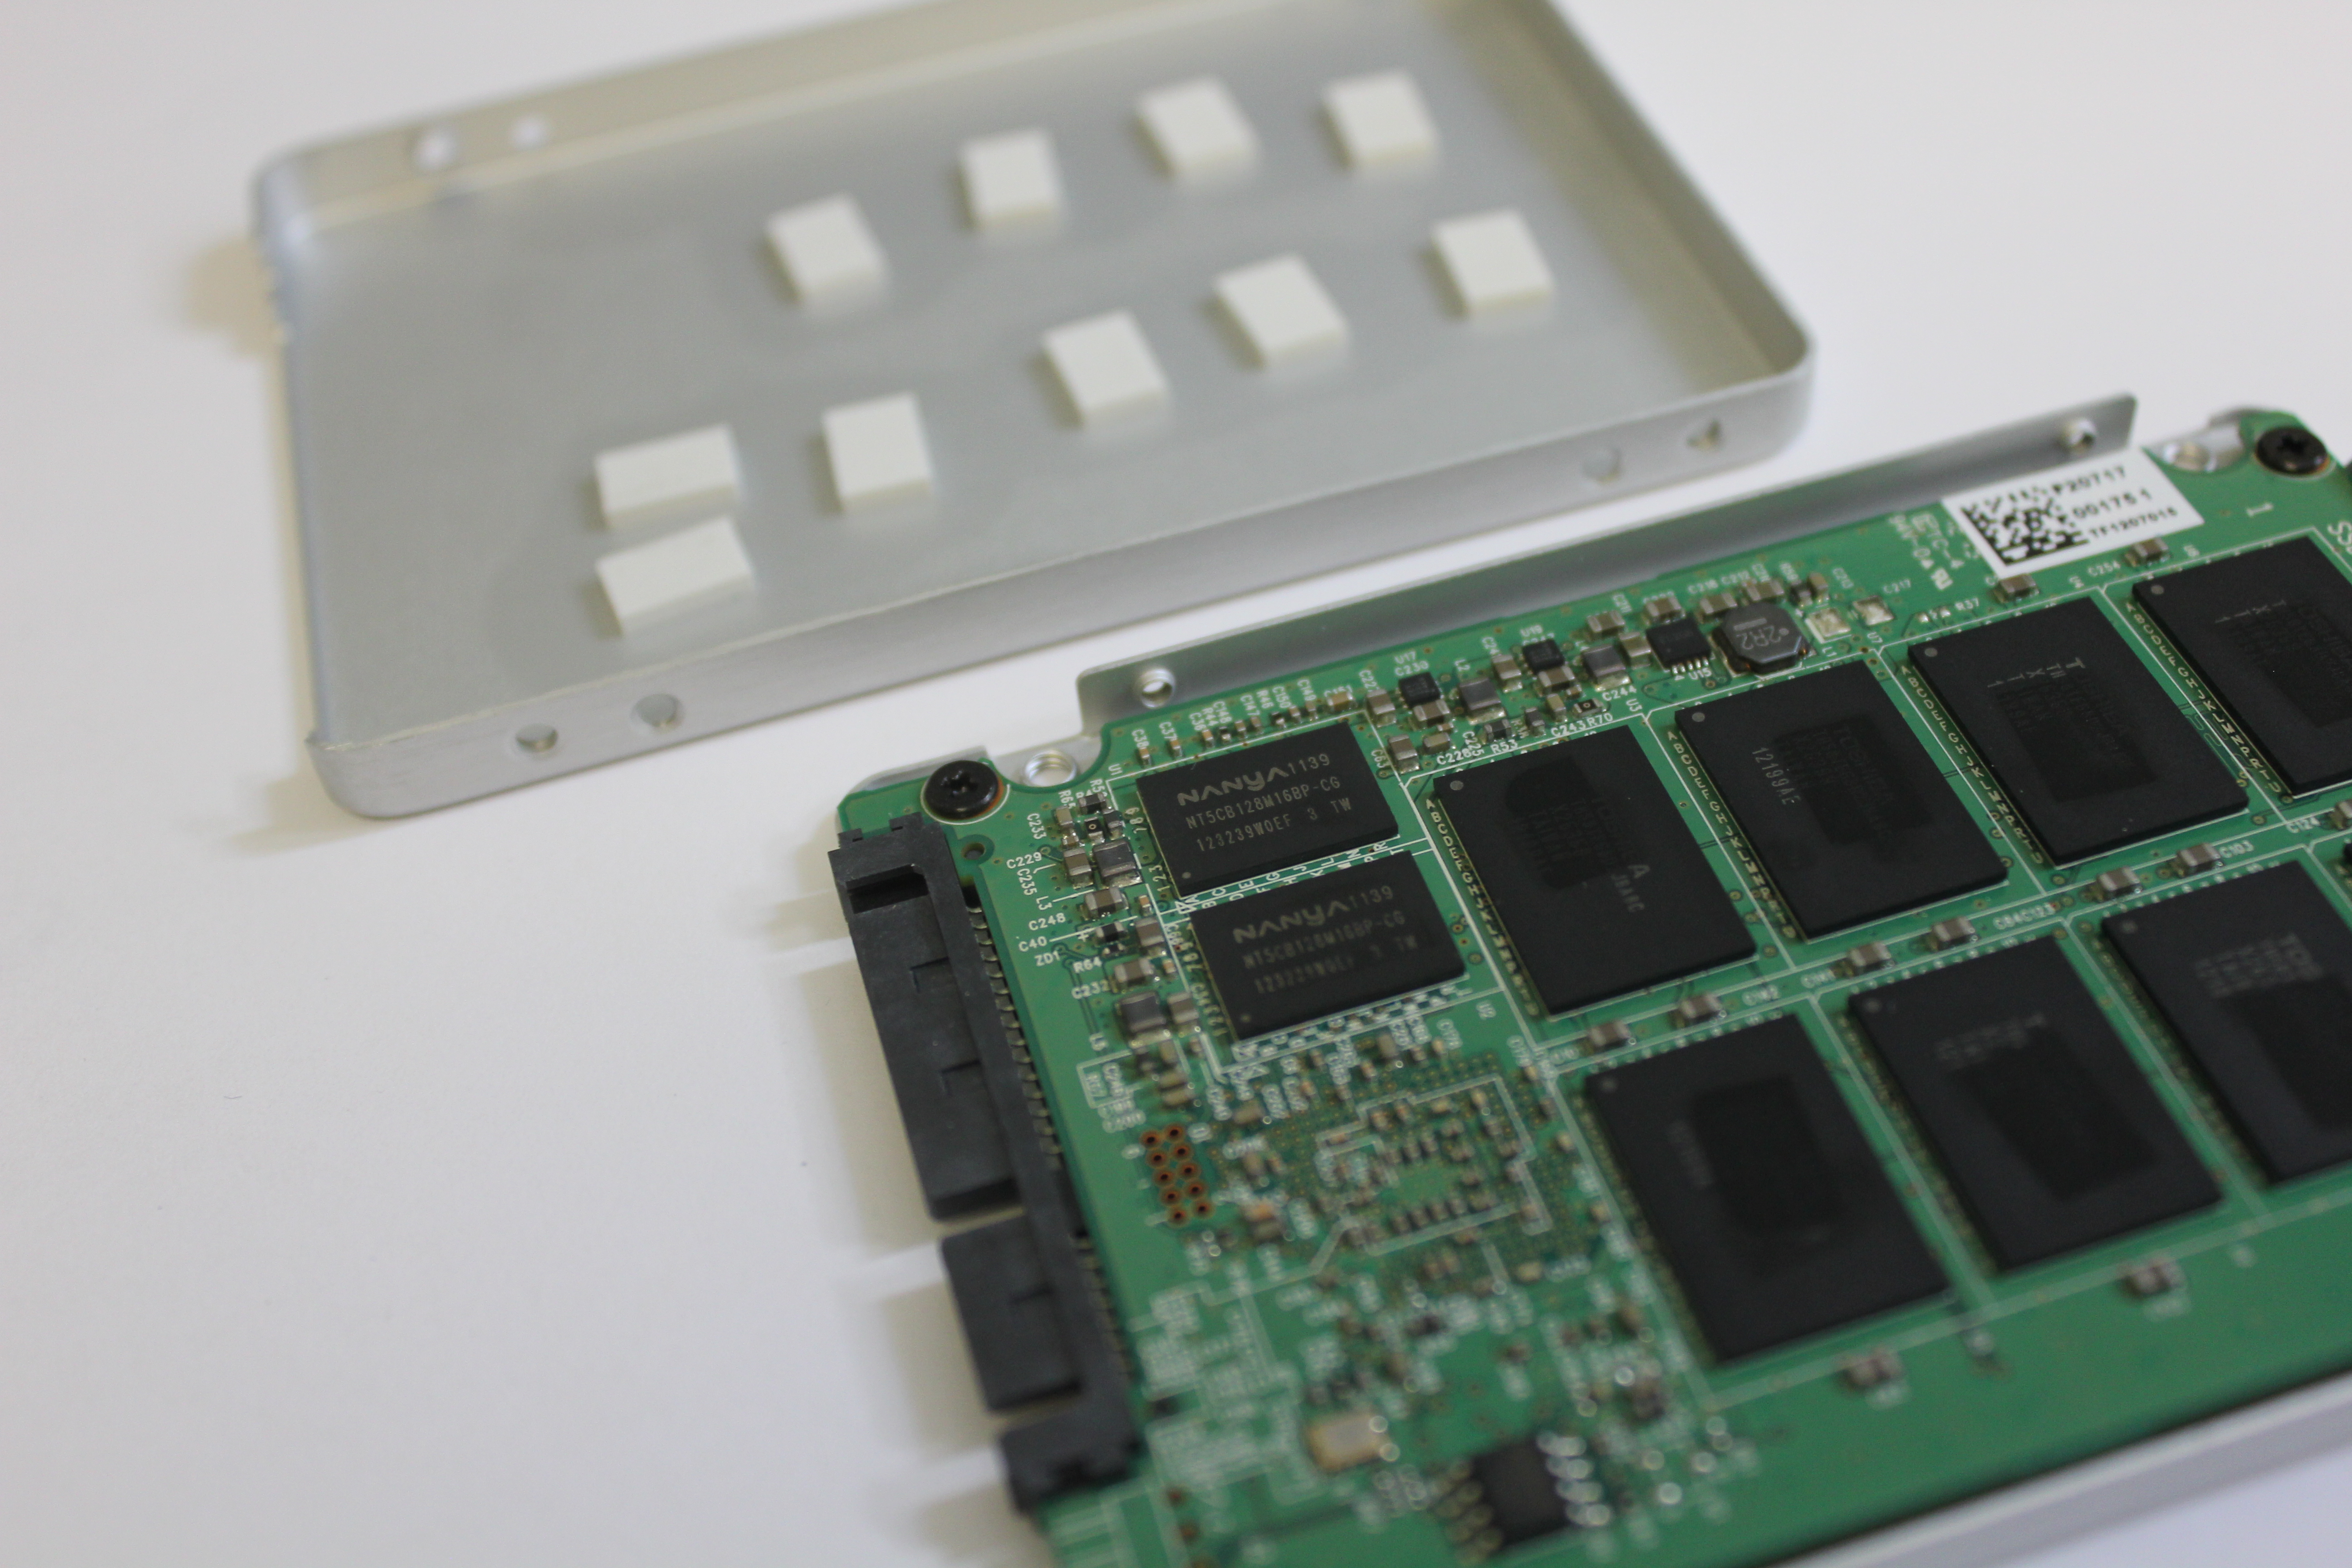
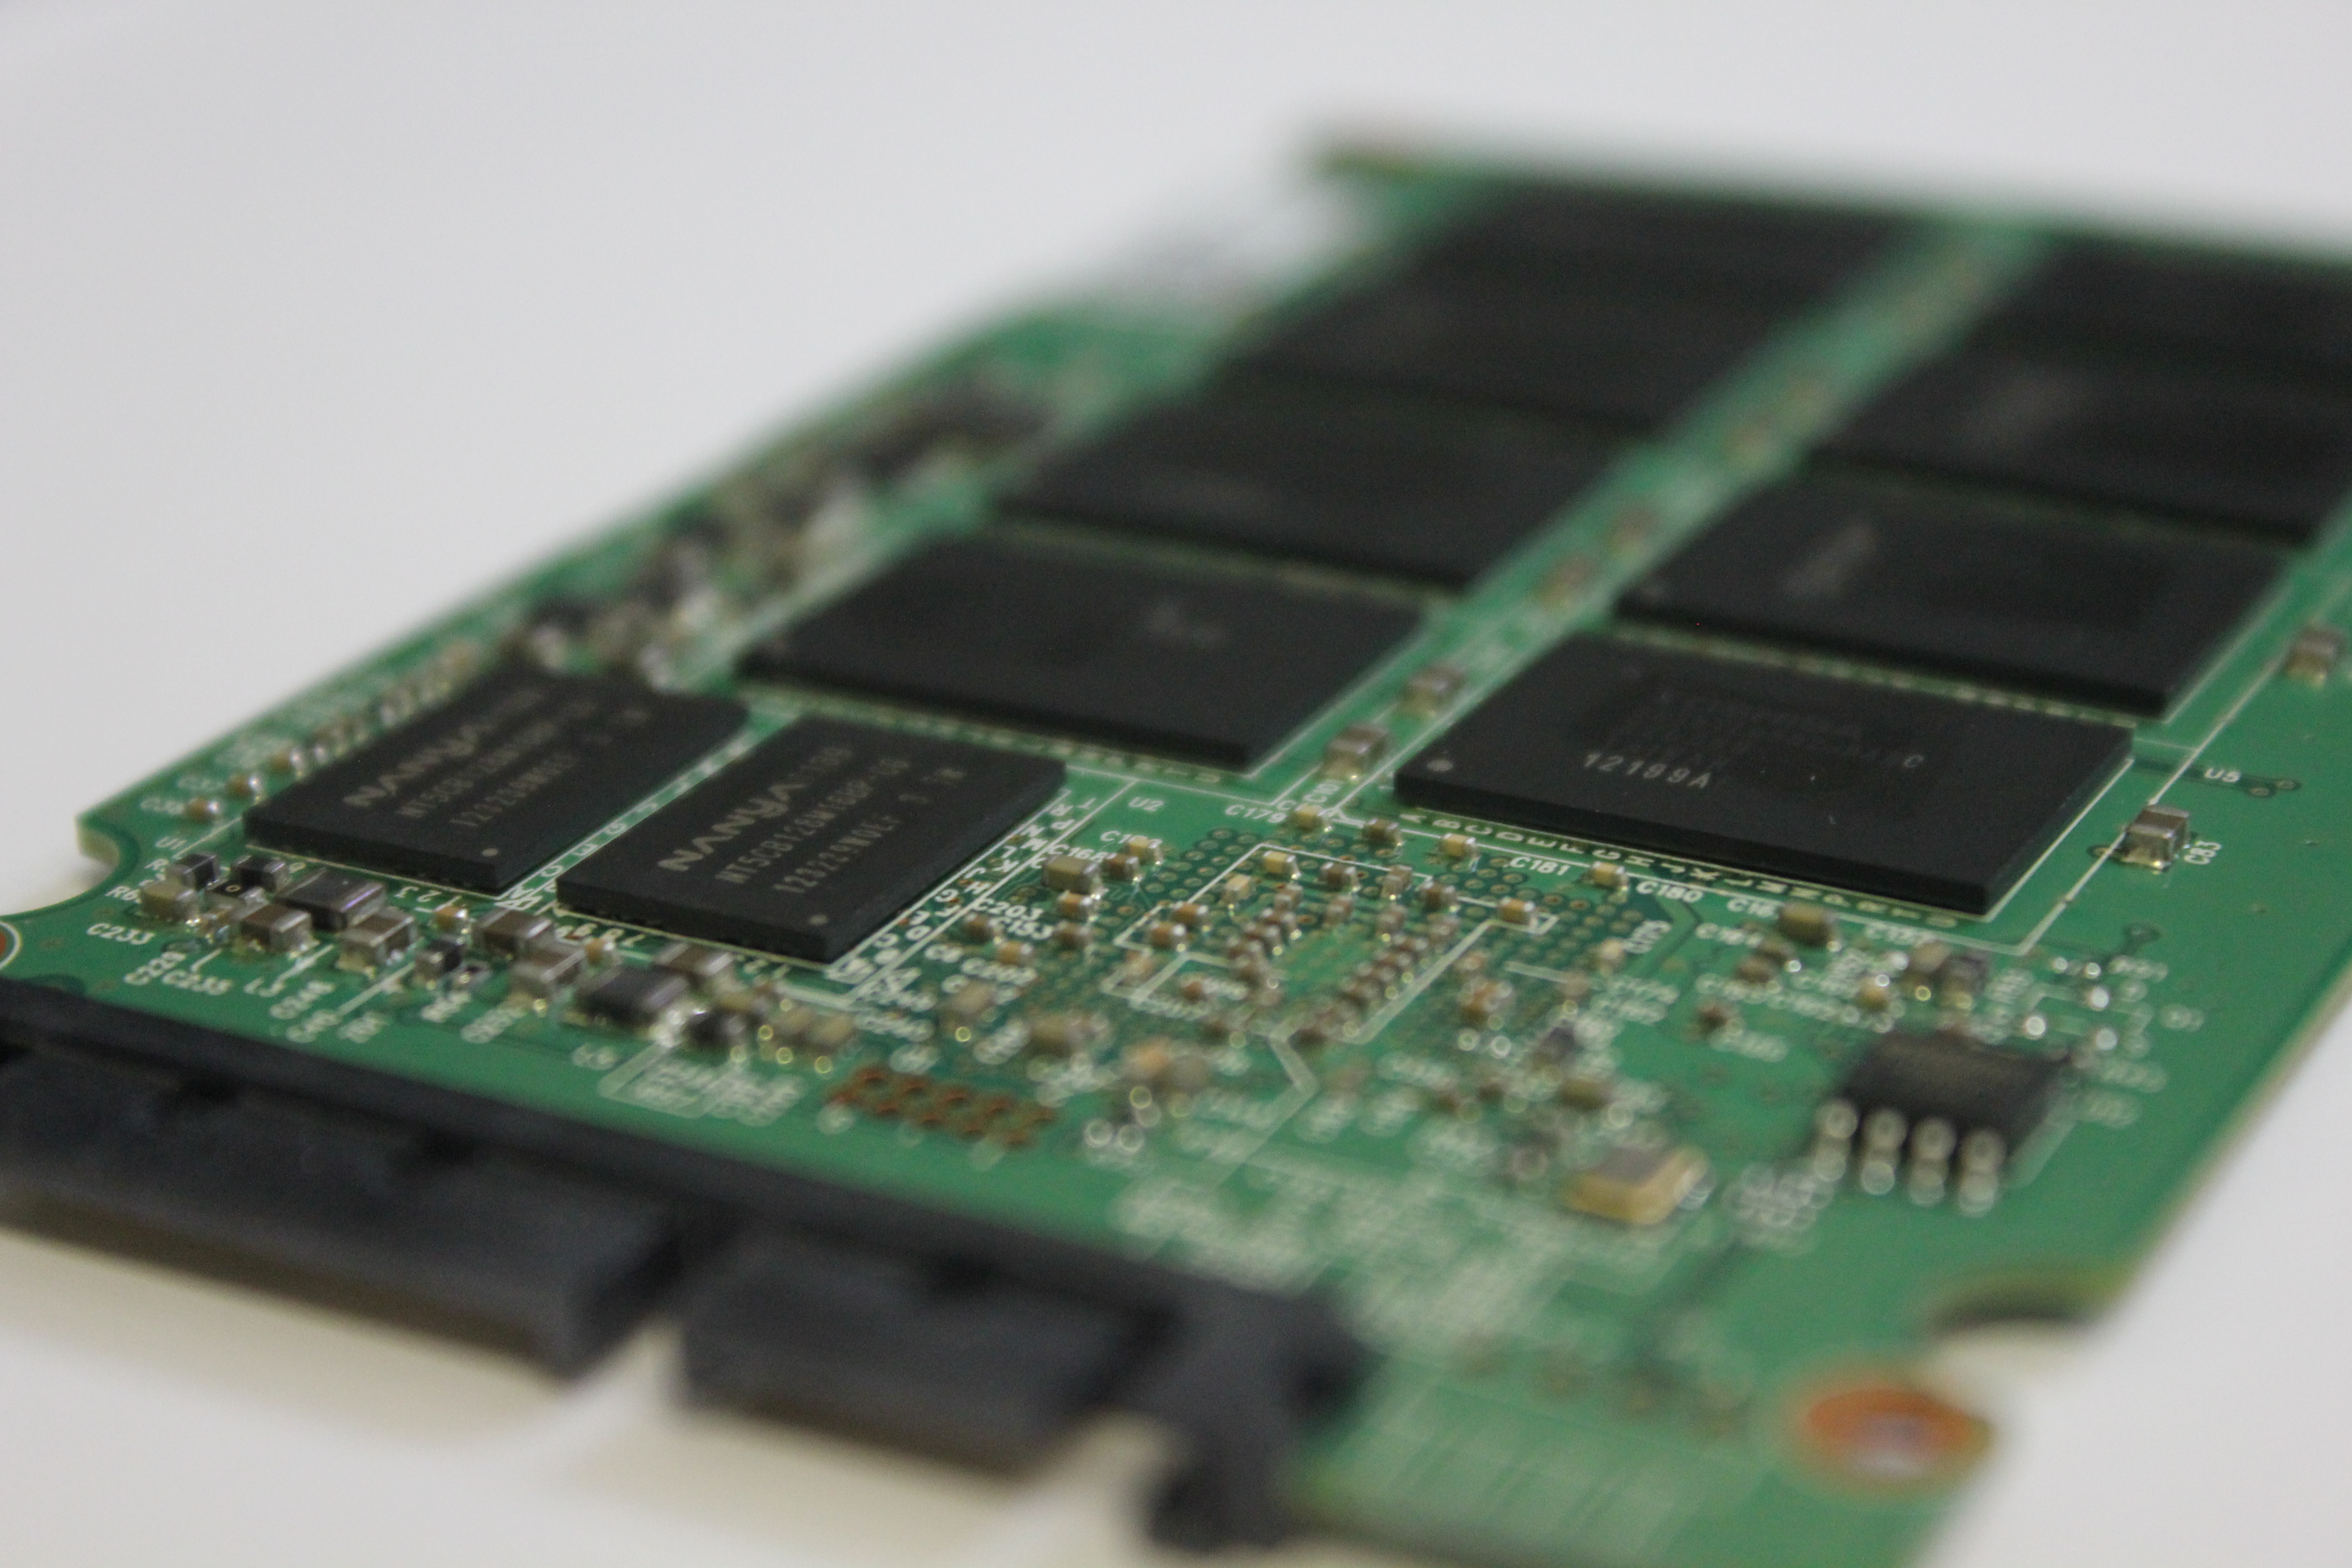
Opening up the M5 Pro reveals eight NAND packages and two SDRAM chips. The specific part number for the NAND is TH58TEG8D2JBA8C. The eleventh letter, J, indicates that the manufacturing process is 19nm as the naming system is alphabetical: A stands for 130nm, B for 90nm and so on. The second last character, which is an 8, reveals that the package is quad-die (32GB) and that Toshiba's 19nm MLC die is still 8GB.
Many of you are probably wondering whether endurance has declined with 19nm NAND. Toshiba is very quiet about their NAND so we have absolutely no official word on the P/E cycle count. However, if IMFT's 20nm NAND is anything to go by, we should still expect to get ~3000 P/E cycles out of 19/20nm NAND. We are still nowhere near P/E cycle figures where endurance would seriously be an issue, as we have explained several times in the past.
Our 256GB model has 512MB of cache, which is provided by two 256MB Nanya DDR3-1333 chips.
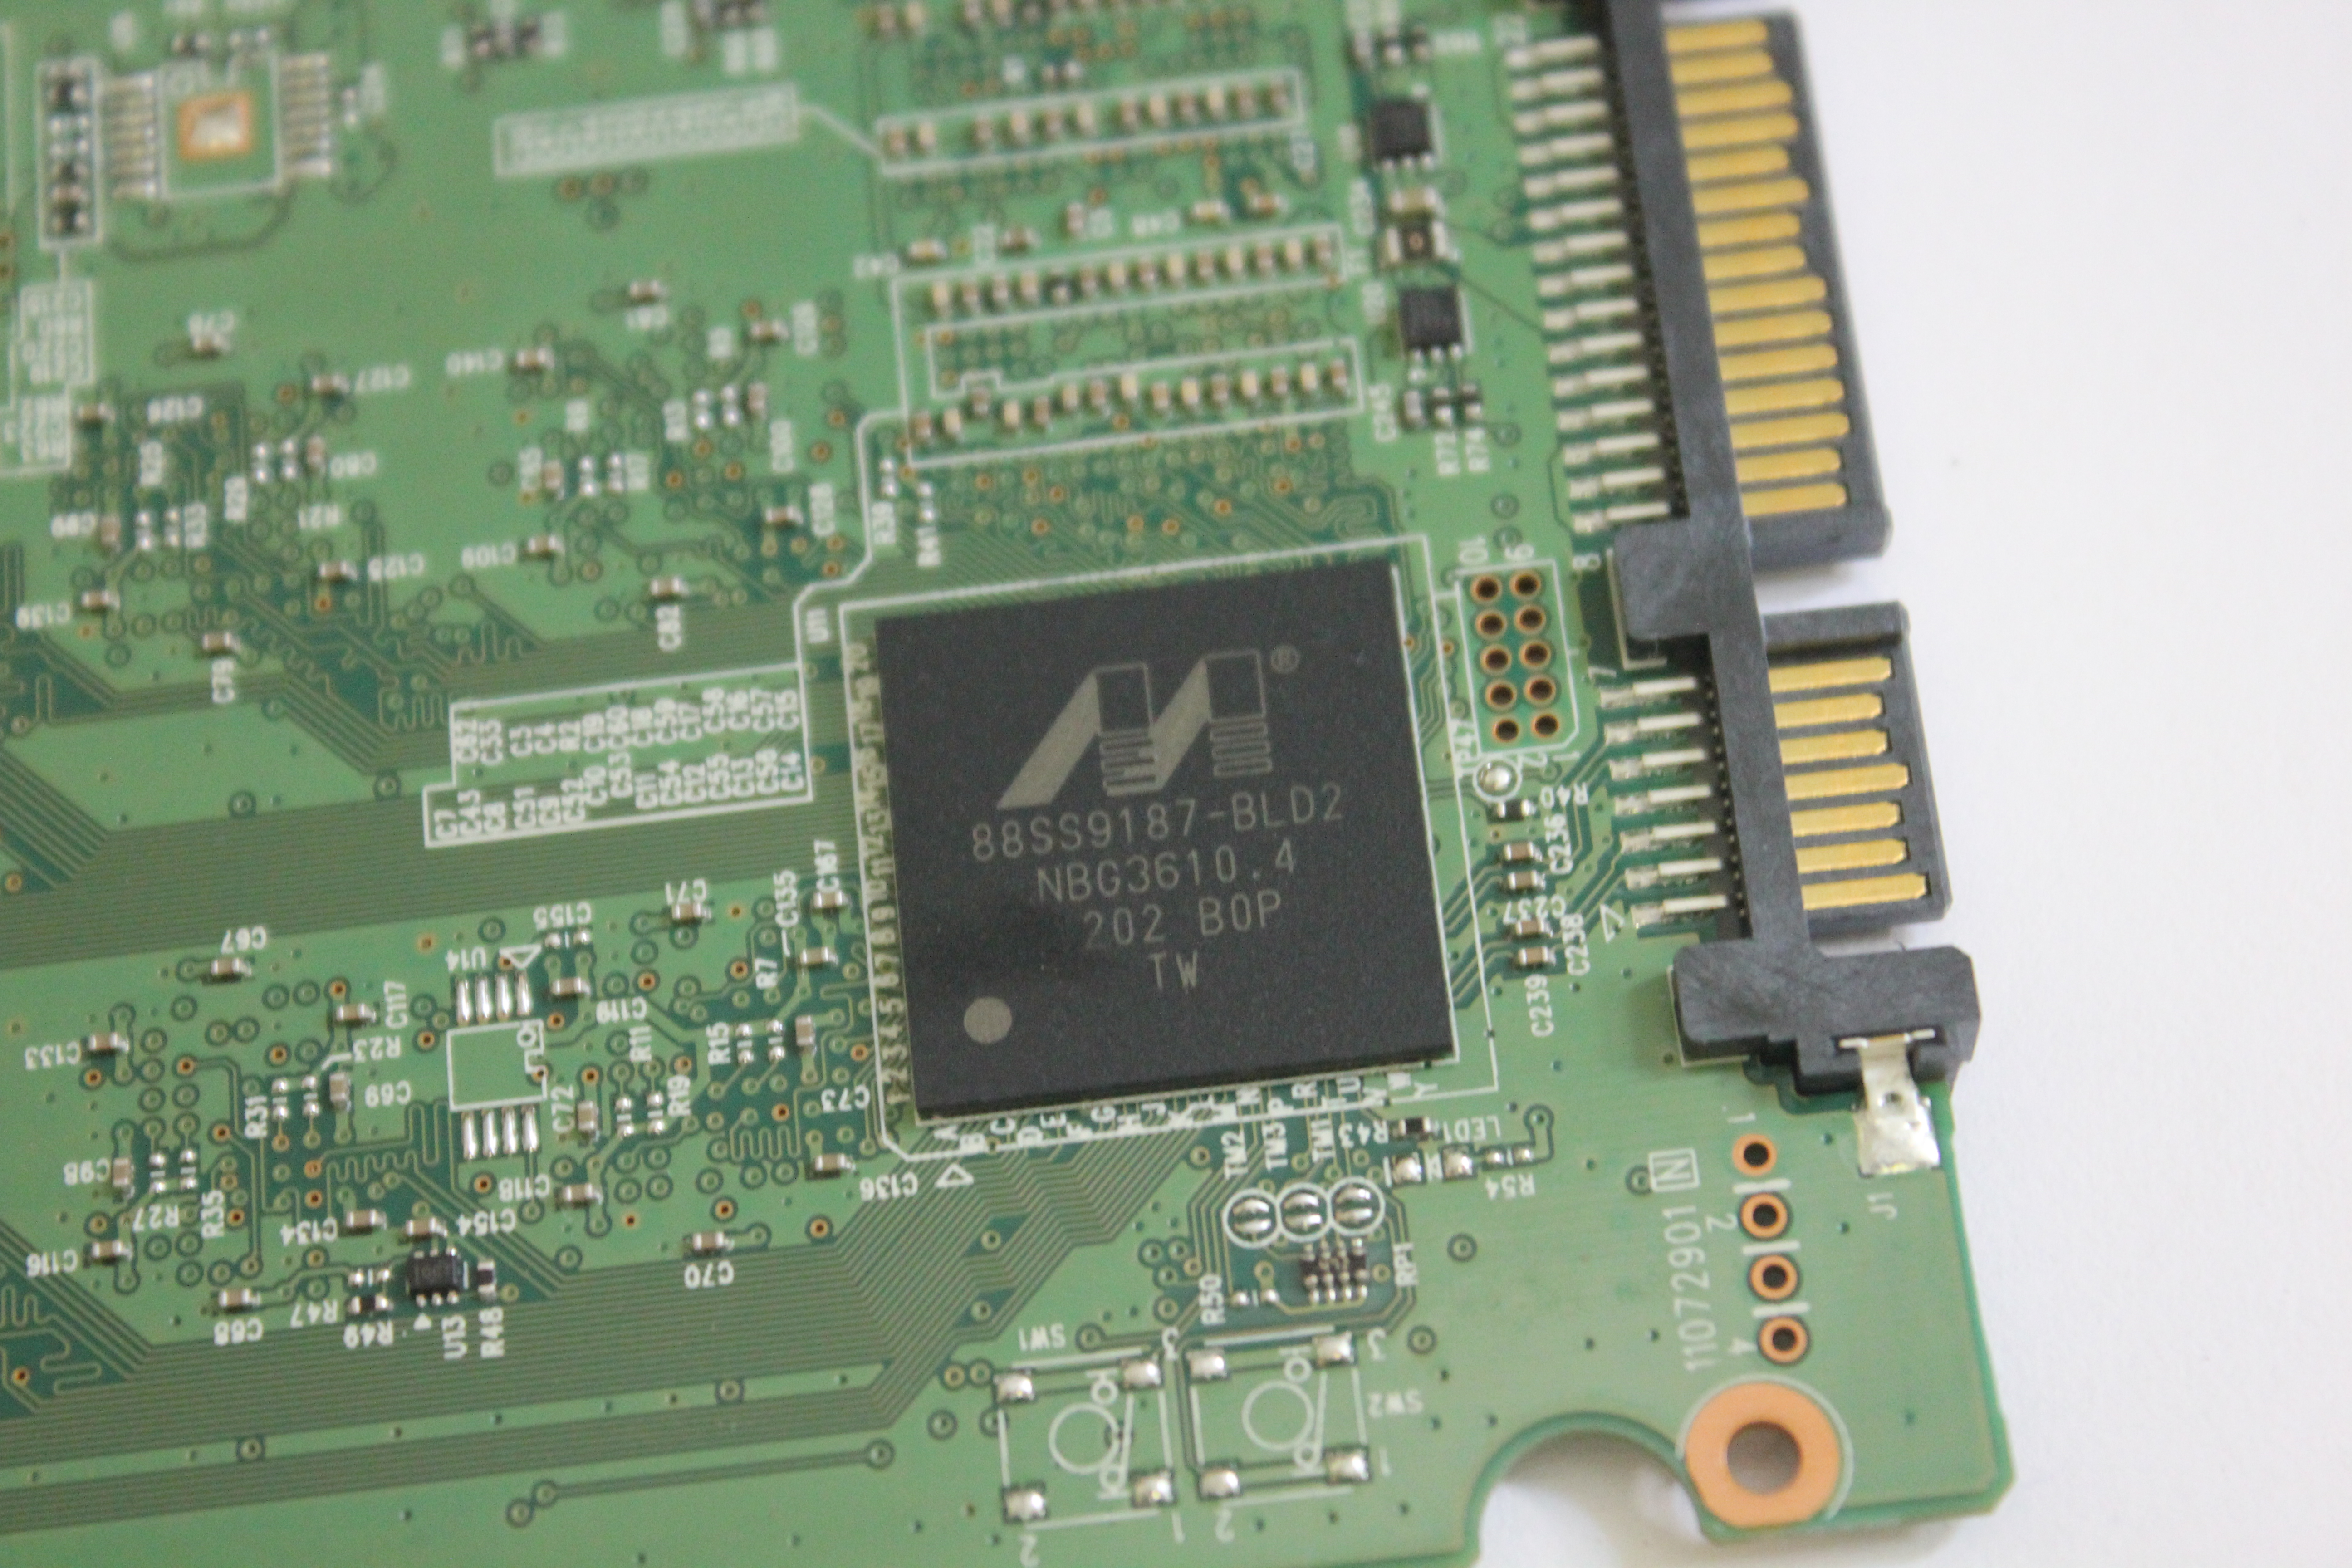
This is it: The Marvell 88SS9187-BLD2. No specific details are known about the new controller, other than that it supports SATA 3.1 and promises "best-in-class" random read/write performance. SATA 3.1 doesn't bring any significant improvements, altough it brings support for mSATA as well as queued TRIM command (the controller can put the TRIM command in queue and keep doing regular operations until it's free to run the TRIM command). Reduced power consumption is also listed in the release notes, although I doubt we'll see any substantial gains.
Test System
| CPU |
Intel Core i5-2500K running at 3.3GHz (Turbo and EIST enabled) |
| Motherboard |
AsRock Z68 Pro3 |
| Chipset |
Intel Z68 |
| Chipset Drivers |
Intel 9.1.1.1015 + Intel RST 10.2 |
| Memory | G.Skill RipjawsX DDR3-1600 2 x 4GB (9-9-9-24) |
| Video Card |
XFX AMD Radeon HD 6850 XXX (800MHz core clock; 4.2GHz GDDR5 effective) |
| Video Drivers | AMD Catalyst 10.1 |
| Desktop Resolution | 1920 x 1080 |
| OS | Windows 7 x64 |
Random Read/Write Speed
The four corners of SSD performance are as follows: random read, random write, sequential read and sequential write speed. Random accesses are generally small in size, while sequential accesses tend to be larger and thus we have the four Iometer tests we use in all of our reviews. Our first test writes 4KB in a completely random pattern over an 8GB space of the drive to simulate the sort of random access that you'd see on an OS drive (even this is more stressful than a normal desktop user would see).
We perform three concurrent IOs and run the test for 3 minutes. The results reported are in average MB/s over the entire time. We use both standard pseudo randomly generated data for each write as well as fully random data to show you both the maximum and minimum performance offered by SandForce based drives in these tests. The average performance of SF drives will likely be somewhere in between the two values for each drive you see in the graphs. For an understanding of why this matters, read our original SandForce article.
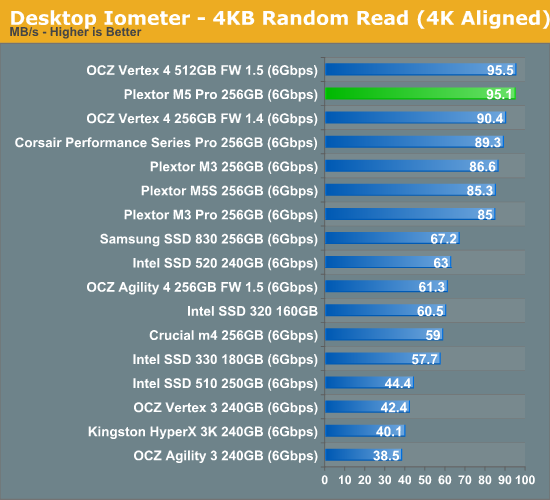
Random read performance is excellent. The M3/Pro already had great random read performance to begin with but M5 Pro takes that one step further. We are looking at figures similar to Vertex 4 here.
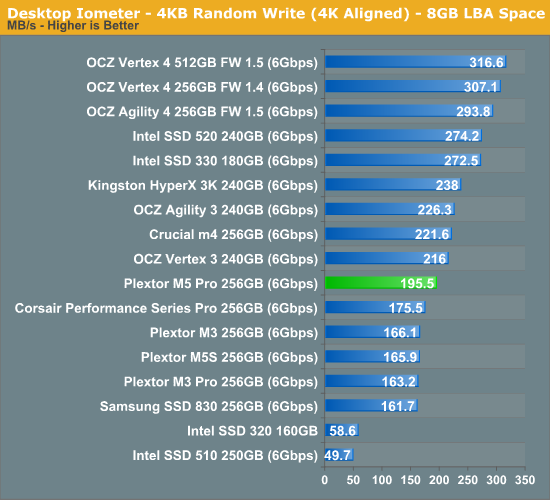
At queue depth of 3, the M5 Pro is noticeably faster than its predecessors. The difference is 30MB/s (~18% on average), although Plextor still cannot match the performance of SandForce or Indilinx Everest 2.
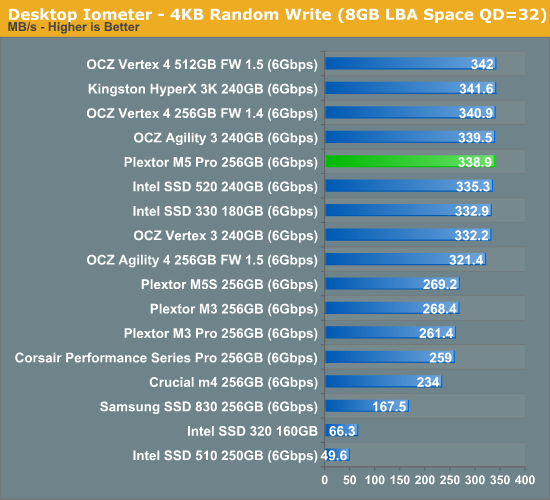
Increasing the queue depth to 32 yields great results. Performance has significantly improved since the M3/Pro. The M5 Pro is on par with SandForce and Everest 2 based SSDs here.
Sequential Read/Write Speed
To measure sequential performance we ran a one minute long 128KB sequential test over the entire span of the drive at a queue depth of 1. The results reported are in average MB/s over the entire test length.
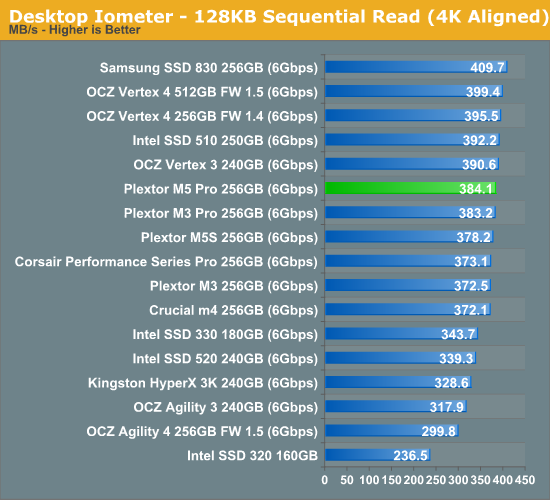
Sequential read performance remains unchanged from M3 Pro.
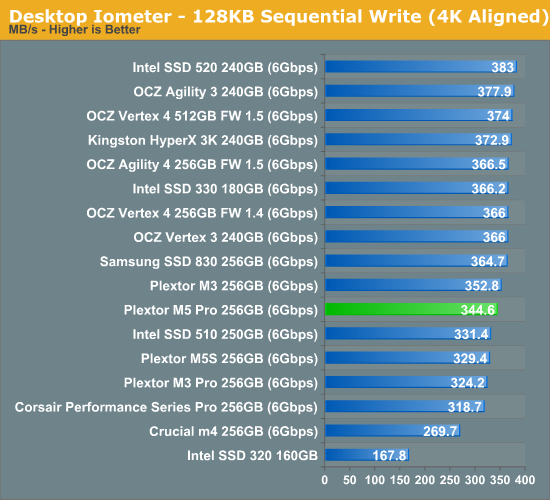
Sequential write is up when compared to M3 Pro, but for some reason, the M3 is still even faster than the M5 Pro.
AS-SSD Incompressible Sequential Performance
The AS-SSD sequential benchmark uses incompressible data for all of its transfers. The result is a pretty big reduction in sequential write speed on SandForce based controllers, while other drives continue to work at roughly the same speed as with compressible data.
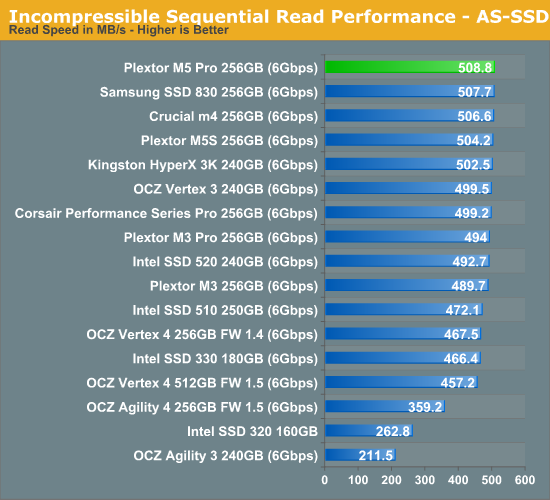
Incompressible read performance is the best we have tested, although I wouldn't get too excited as the differences here are very insignificant. The M5 Pro is only 3% faster than the M3 Pro.
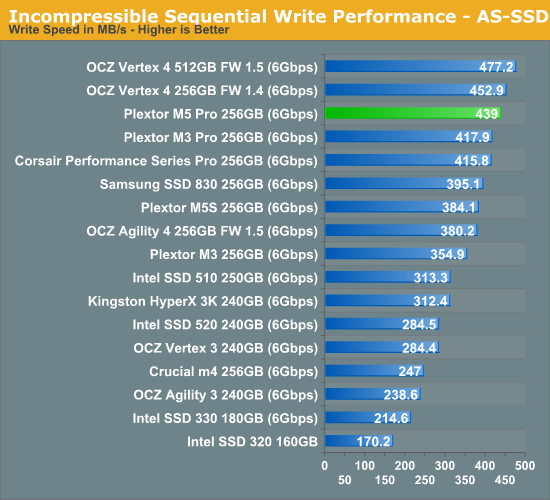
Incompressible write performance is also great, although Vertex 4 gets to keep its crown. Again, differences are minor when looking at percentages (the M5 Pro is ~5% faster than the M3 Pro).
Performance vs. Transfer Size
All of our IOmeter sequential tests happen at a queue depth of 1, which is indicative of a light desktop workload. It isn't too far fetched to see much higher queue depths on the desktop. The performance of these SSDs also greatly varies based on the size of the transfer. For this next test we turn to ATTO and run a sequential write over a 2GB span of LBAs at a queue depth of 4 and varying the size of the transfers.
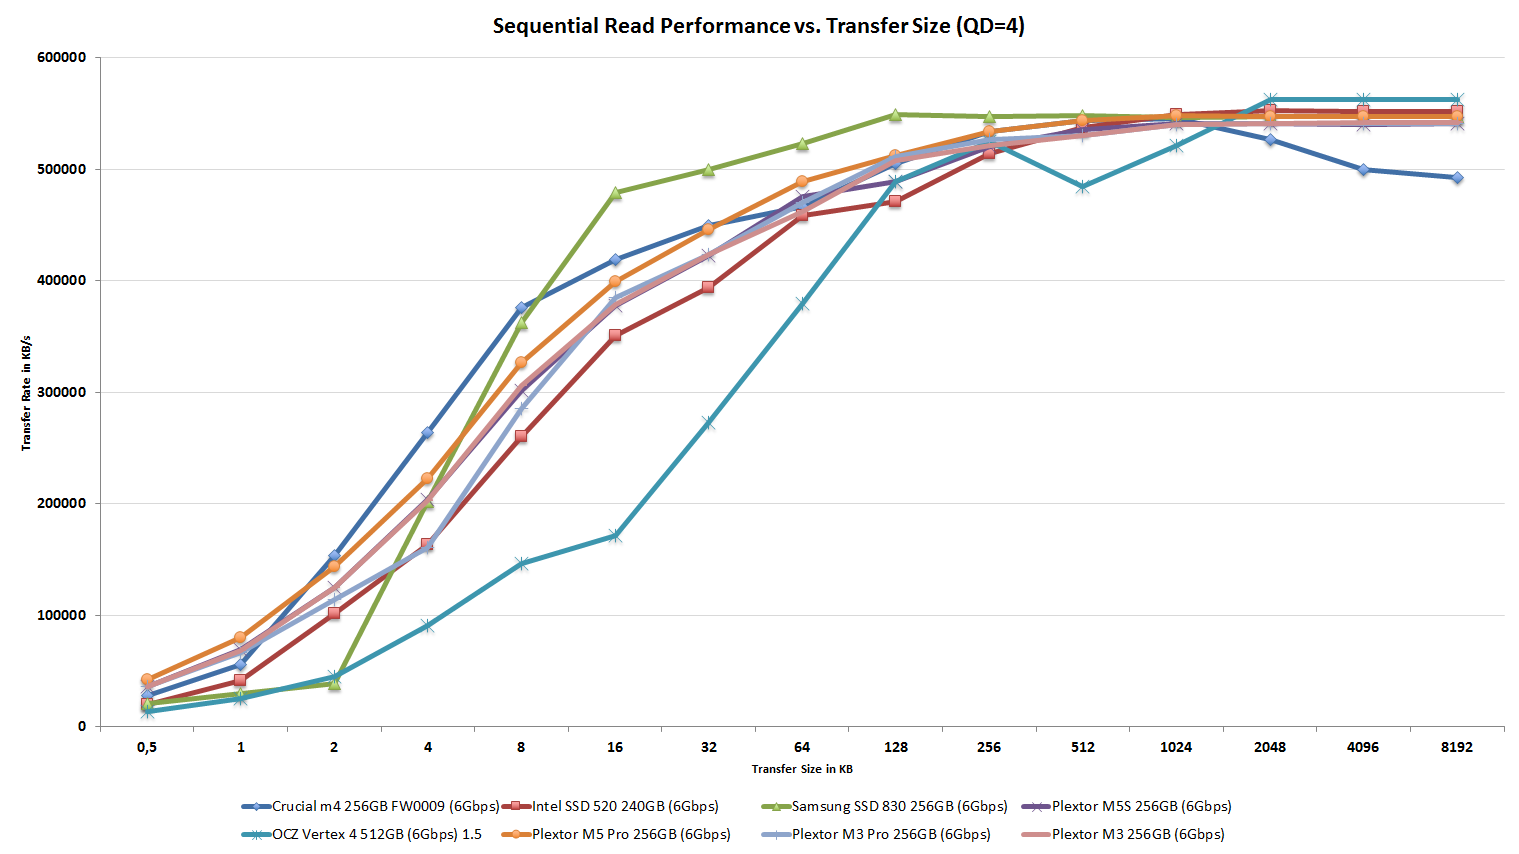
Click for full size
Sequential read performance is marginally faster compared to M3 Pro and overall excellent at all transfer sizes.
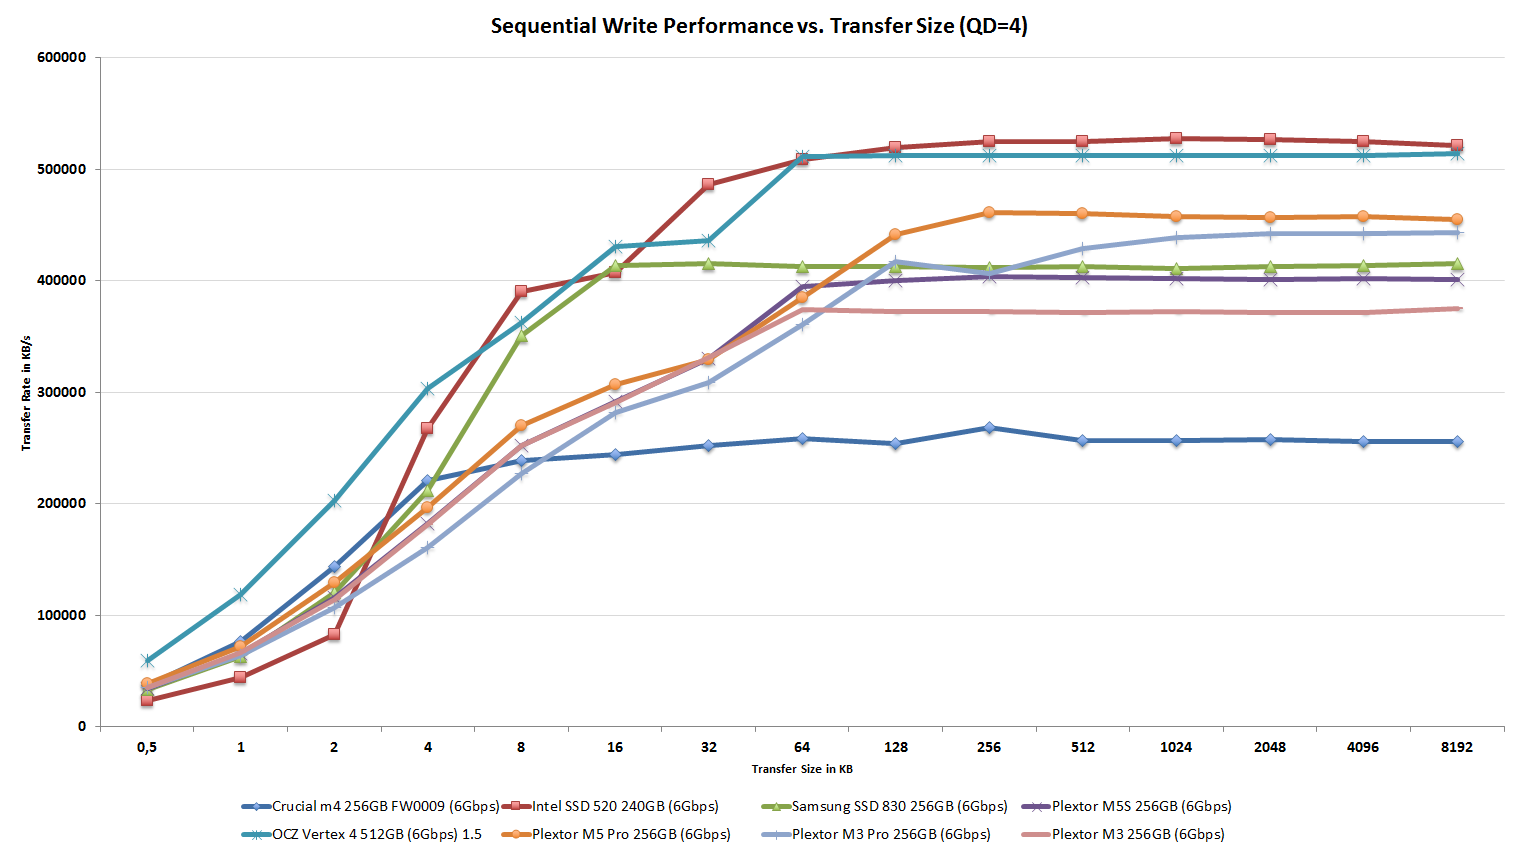
Sequential write speed is also slightly better than what the M3 Pro offers, although performance between IO sizes of 4KB and 64KB could be a bit better.
AnandTech Storage Bench 2011
Last year we introduced our AnandTech Storage Bench, a suite of benchmarks that took traces of real OS/application usage and played them back in a repeatable manner. Anand assembled the traces out of frustration with the majority of what we have today in terms of SSD benchmarks.
Although the AnandTech Storage Bench tests did a good job of characterizing SSD performance, they weren't stressful enough. All of the tests performed less than 10GB of reads/writes and typically involved only 4GB of writes specifically. That's not even enough exceed the spare area on most SSDs. Most canned SSD benchmarks don't even come close to writing a single gigabyte of data, but that doesn't mean that simply writing 4GB is acceptable.
Originally we kept the benchmarks short enough that they wouldn't be a burden to run (~30 minutes) but long enough that they were representative of what a power user might do with their system. Later, however, we created what we refer to as the Mother of All SSD Benchmarks (MOASB). Rather than only writing 4GB of data to the drive, this benchmark writes 106.32GB. This represents the load you'd put on a drive after nearly two weeks of constant usage. And it takes a long time to run.
1) The MOASB, officially called AnandTech Storage Bench 2011—Heavy Workload, mainly focuses on the times when your I/O activity is the highest. There is a lot of downloading and application installing that happens during the course of this test. Our thinking was that it's during application installs, file copies, downloading, and multitasking with all of this that you can really notice performance differences between drives.
2) We tried to cover as many bases as possible with the software incorporated into this test. There's a lot of photo editing in Photoshop, HTML editing in Dreamweaver, web browsing, game playing/level loading (Starcraft II and WoW are both a part of the test), as well as general use stuff (application installing, virus scanning). We included a large amount of email downloading, document creation, and editing as well. To top it all off we even use Visual Studio 2008 to build Chromium during the test.
The test has 2,168,893 read operations and 1,783,447 write operations. The IO breakdown is as follows:
| AnandTech Storage Bench 2011—Heavy Workload IO Breakdown | ||||
| IO Size | % of Total | |||
| 4KB | 28% | |||
| 16KB | 10% | |||
| 32KB | 10% | |||
| 64KB | 4% | |||
Only 42% of all operations are sequential; the rest ranges from pseudo to fully random (with most falling in the pseudo-random category). Average queue depth is 4.625 IOs, with 59% of operations taking place in an IO queue of 1.
Many of you have asked for a better way to really characterize performance. Simply looking at IOPS doesn't really say much. As a result we're going to be presenting Storage Bench 2011 data in a slightly different way. We'll have performance represented as Average MB/s, with higher numbers being better. At the same time we'll be reporting how long the SSD was busy while running this test. These disk busy graphs will show you exactly how much time was shaved off by using a faster drive vs. a slower one during the course of this test. Finally, we will also break out performance into reads, writes, and combined. The reason we do this is to help balance out the fact that this test is unusually write intensive, which can often hide the benefits of a drive with good read performance.
There's also a new light workload for 2011. This is a far more reasonable, typical every day use case benchmark. It has lots of web browsing, photo editing (but with a greater focus on photo consumption), video playback, as well as some application installs and gaming. This test isn't nearly as write intensive as the MOASB but it's still multiple times more write intensive than what we were running last year.
We don't believe that these two benchmarks alone are enough to characterize the performance of a drive, but hopefully along with the rest of our tests they will help provide a better idea. The testbed for Storage Bench 2011 has changed as well. We're now using a Sandy Bridge platform with full 6Gbps support for these tests.
AnandTech Storage Bench 2011—Heavy Workload
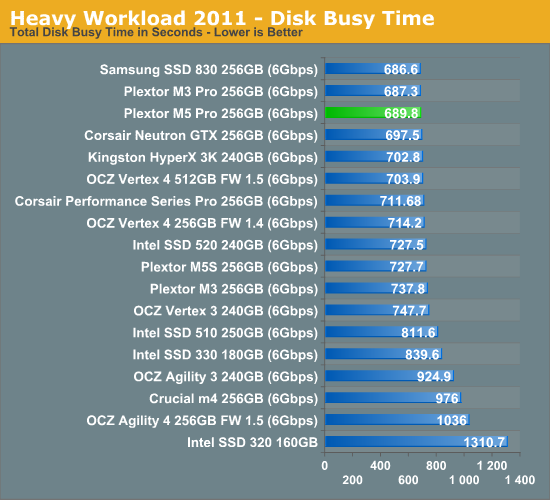
We'll start out by looking at average data rate throughout our new heavy workload test:
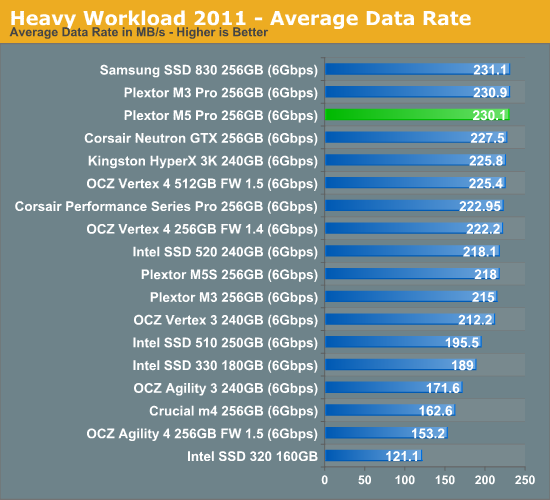
Surprisingly, the M5 Pro is slightly slower than the M3 Pro in our Heavy suite. In all of our synthetic benchmarks, the M5 Pro was faster and in some cases by far.
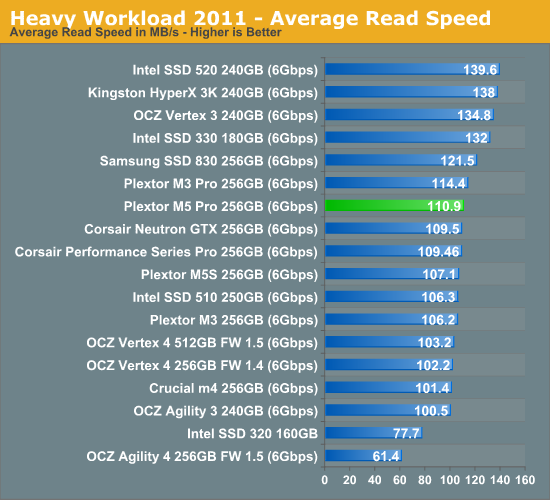
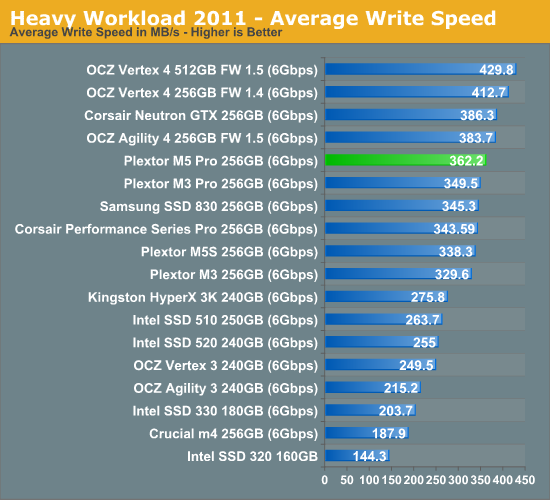
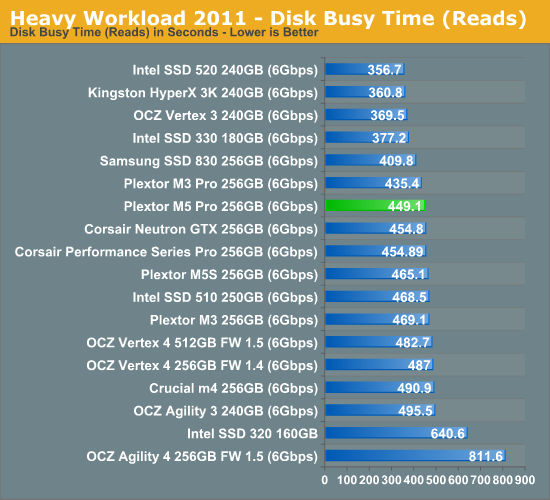
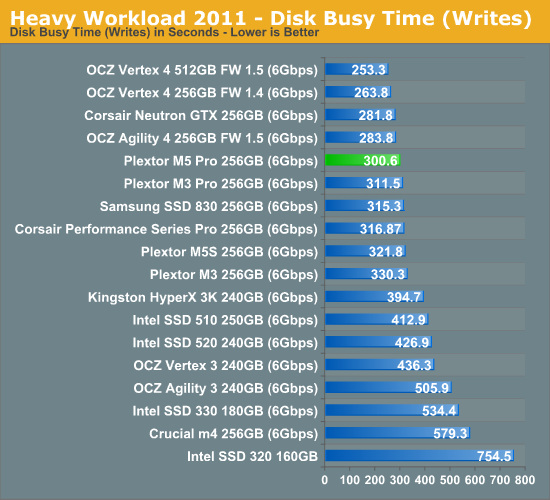
Read speed is where the M5 Pro is slower than the M3 Pro. While the difference is only 3.5MB/s, it's enough to make the average data rate smaller since our Heavy suite has more read operations. Write speed, on the other hand, is faster.
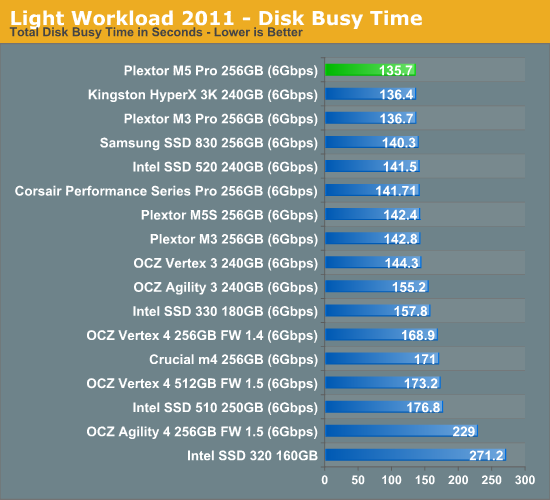
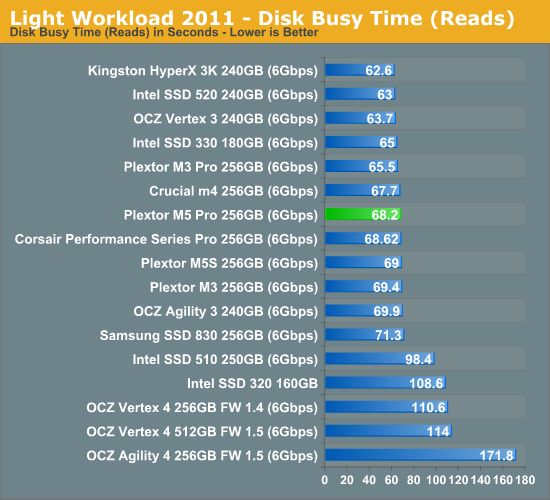
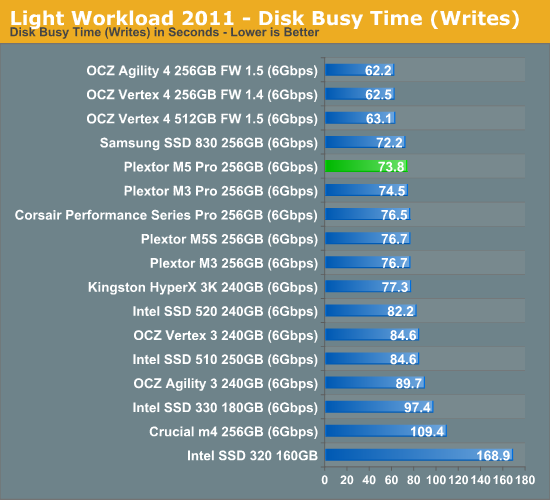
The next three charts just represent the same data, but in a different manner. Instead of looking at average data rate, we're looking at how long the disk was busy for during this entire test. Note that disk busy time excludes any and all idles; this is just how long the SSD was busy doing something:
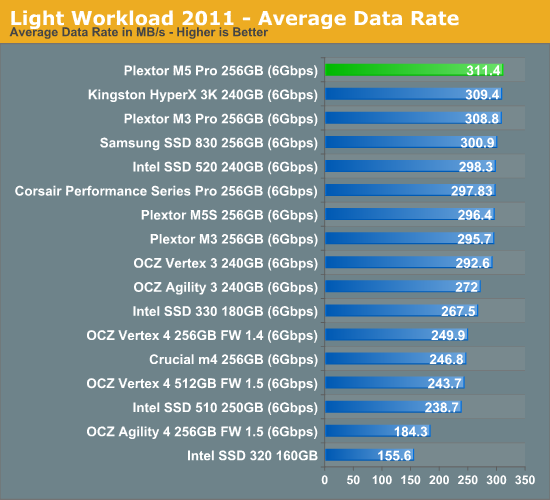
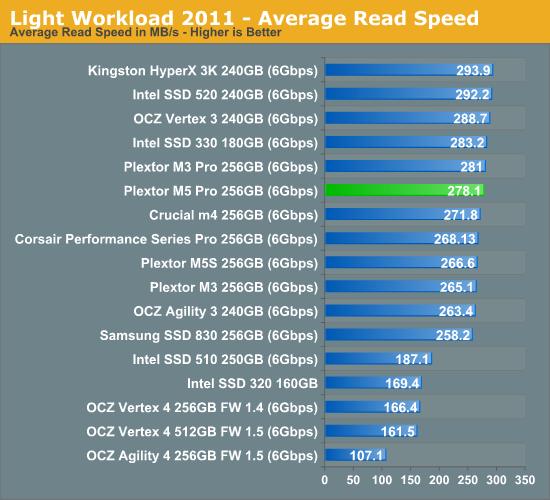
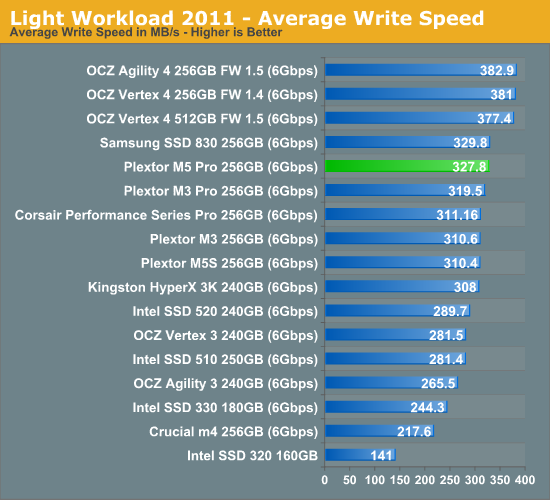
AnandTech Storage Bench 2011, Light Workload
Our new light workload actually has more write operations than read operations. The split is as follows: 372,630 reads and 459,709 writes. The relatively close read/write ratio does better mimic a typical light workload (although even lighter workloads would be far more read centric). The I/O breakdown is similar to the heavy workload at small IOs, however you'll notice that there are far fewer large IO transfers:
| AnandTech Storage Bench 2011—Light Workload IO Breakdown | ||||
| IO Size | % of Total | |||
| 4KB | 27% | |||
| 16KB | 8% | |||
| 32KB | 6% | |||
| 64KB | 5% | |||
Performance Over Time & TRIM
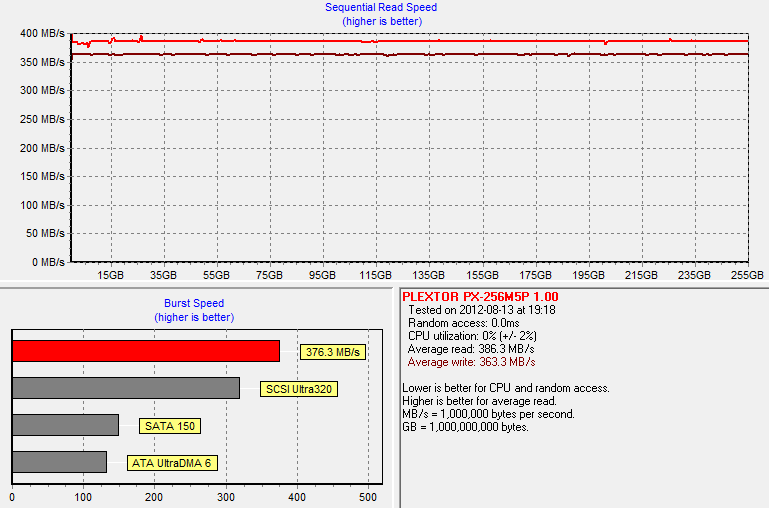
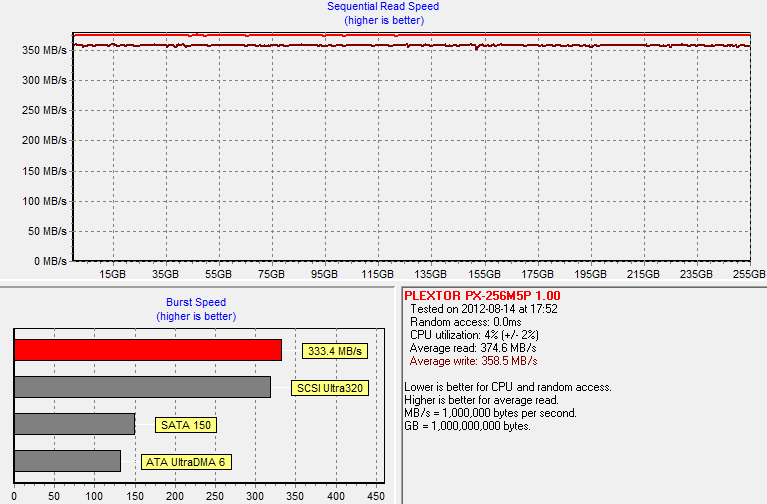
Just like Plextor's other SSDs we have tested, the M5 Pro comes with Plextor's proprietary "True Speed" technology. At the ground level, "True Speed" is just a fancy name for Plextor's own garbage collection and wear leveling algorithms, which we have found to be fairly effective. As usual, lets run HD Tach on a secure erased drive to get baseline performance:
I secure erased the drive again, filled all user accessible LBAs with sequential data and proceeded with our 20-minute torture test (4KB random writes at queue depth of 32 and 100% LBA space):
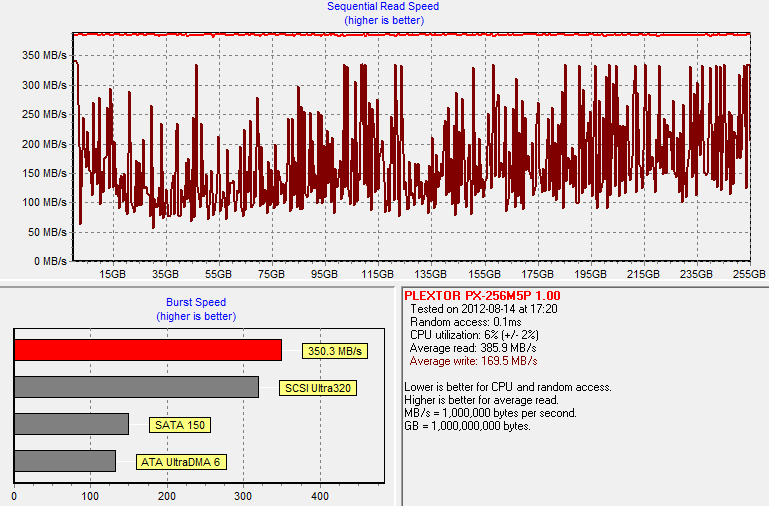
There are no surprises here. Write speed is jumping back and forth from as low as 60MB/s to up to 340MB/s. Average write speed is 169.5MB/s, which is similar to what we have seen with other Plextor SSDs.
While 20 minutes of torture is more than enough to create a worst case scenario for a consumer workload, it's not enough to put today's drives in the worst possible state. Thus I secure erased the drive and extended the length of torture to 60 minutes:
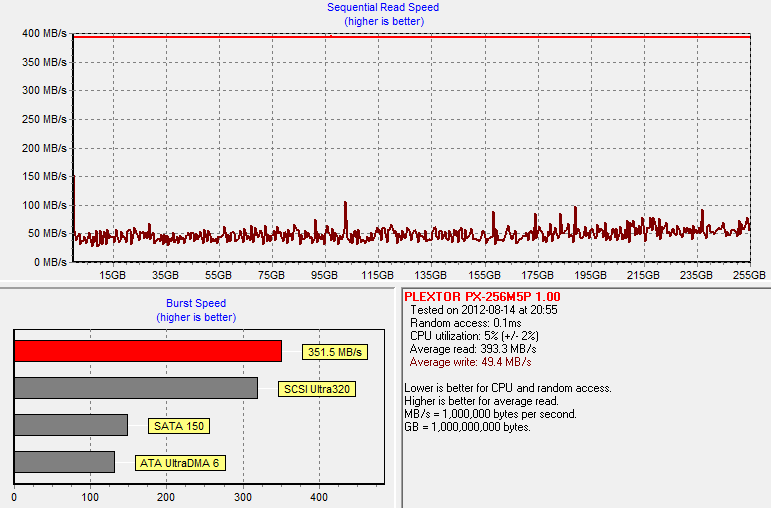
And average performance drops to around 50MB/s. That's actually 12.3MB/s slower than what the M5S scored in a similar test, although 50MB/s is fairly normal for non-SandForce SSDs.
Next I let the drive idle for 30 minutes to let Plextor's idle time garbage collection go to work:
.PNG)
Performance is significantly better compared to what it was before the idle time. Write speeds are now ranging from 80MB/s to up to 340MB/s, and the average ends up being 201.4MB/s. The M5S did recover better from dirty state, although this stuff isn't always deterministic.
Most SSDs are used in TRIM-supported environments thankfully. After 20-minute torture and one run of HD Tach, I TRIM'ed the drive to make sure TRIM works properly:
Power Consumption
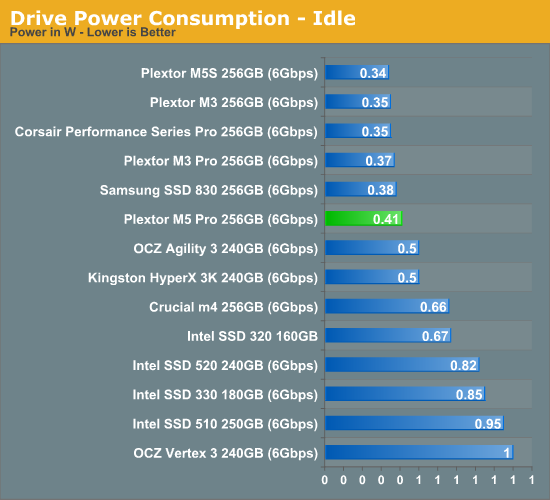
Idle power consumption is slightly up from the M3 Pro, although the difference is rather small.
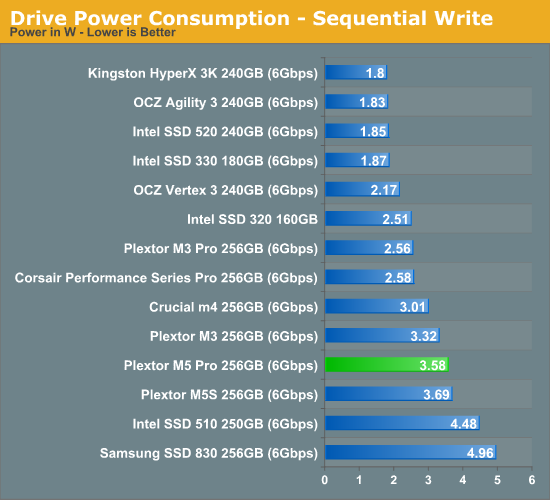
Power consumption during sequential writes is also significantlyl higher (~40%) compared to the M3 Pro.
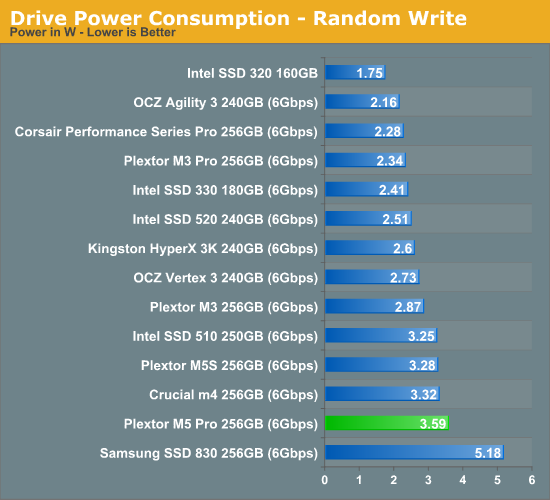
Random write power consumption is high as well. Given that the M3 Pro had such a great power efficiency, I really hope Plextor can provide a firmware with more efficient power characteristics. Of course, it's definitely possible that the new Marvell 9187 controller just consumes more power.
The M3 Pro was one of the fastest SATA 6Gbps SSDs we have tested and I was certain that the M5 Pro would take the crown since it was supposed to be faster than the M3 Pro. However, even though the M5 Pro is faster than the M3 Pro in all of our synthetic tests, it pretty much breaks even in our Storage suites. That doesn't mean that the M5 Pro is slow by any means, it's simply not much of an upgrade. As the M3 Pro is phased out, the M5 Pro will at least be a suitable replacement.
The bigger issue is power consumption. One of the main reasons I liked the M3 Pro was its extremely low power consumption. The M5 Pro consumes significantly more power and performance is only slightly better. For desktop users, the increased power consumption should not be an issue but purchasing decisions for notebook drives are often driven by power efficiency. Higher power consumption obviously leads to worse battery life.
Dealing with a new controller is not always easy, though. Plextor has been using Marvell's 9174 controller since the M2 series, so the same controller has been used in five different SSDs. Plextor has had plenty of time to tweak the 9174 firmware and that's clearly visible in the M3 Pro: performance is finely tuned and the firmware is mature. The M5 Pro, on the other hand, is their first product to use the new 9187 controller and firmware. It's also Plextor's first drive to use 19nm Toshiba NAND. Integrating smaller process geometry NAND has always been a performance challenge, it's possible that we're just seeing the outcome of those difficulties. Finally there's the chance that we're simply hitting the limits of what you can get over 6Gbps SATA. The M5 Pro is by no means a slow drive, it's clearly among the fastest we've tested. There's only so much parallelism you can extract from smaller transfers, and at the high end we've been gated by the SATA interface's limitations.
Despite not breaking any records, the M5 Pro is a good drive. Without any huge increases in performance via firmware updates however, the M5 Pro needs to be competitive on price. The M3 Pro wasn't priced as aggressively as it needed to be, but with the M5 Pro Plextor has another chance.


